Imbalanced Data and Bags of Logistic Regressions
Experiments with three different strongly-imbalanced datasets.
#collapse
import pickle
from collections import defaultdict
from itertools import product
from pathlib import Path

import numpy as np
import pandas as pd
import matplotlib.pyplot as plt
from tqdm import tqdm

from imblearn.datasets import fetch_datasets
from imblearn.ensemble import BalancedRandomForestClassifier, BalancedBaggingClassifier
from imblearn.over_sampling import SMOTE, RandomOverSampler
from imblearn.pipeline import make_pipeline

from sklearn.datasets import make_blobs
from sklearn.model_selection import cross_validate, cross_val_predict, StratifiedKFold
from sklearn.metrics import precision_recall_curve
from sklearn.linear_model import LogisticRegression
from sklearn.preprocessing import StandardScaler
Imbalanced datasets occur in various fields and create unique challenges in model training as well as evaluation. In this post, we compare a few ensemble algorithms on imbalanced datasets. We delve deeper on a specific model: a bag of logistic regressions, and discuss why it might be a good choice for many imbalanced datasets.
#collapse

abalone_fname = 'abalone.feather'

def fetch_abalone():
    """Download Abalone dataset from UCI archives and load in Pandas"""
    abalone_uci = 'http://archive.ics.uci.edu/ml/machine-learning-databases/abalone/abalone.data'
    abalone = pd.read_csv(abalone_uci, header=None)
    abalone.columns = ['sex', 'length', 'diameter', 'height', 'whole_weight', 'shucked_weight',
                       'viscera_weight', 'shell_weight', 'rings']
    abalone = pd.get_dummies(abalone, columns=['sex'])
    abalone.to_feather(abalone_fname)  # save local copy
    return abalone

def abalone_Xy(thr):
    """For a given threshold thr, all values above the threshold become
    the positive class in binary classification"""
    return {
        'data': abalone.drop(columns='rings'),
        'target': (abalone['rings'] >= thr).astype(np.int32),
        'DESCR': f'abalone_{thr}+'
    }

def get_stats(ds):
    """Extract statistics from a dataset."""
    n_examples, n_feats = ds['data'].shape
    is_positive = ds['target'] == 1
    return {
        'name': ds['DESCR'],
        'n_examples': n_examples,
        'n_feats': n_feats,
        'prop_positive': is_positive.mean(),
        'n_positive': is_positive.sum()
    }


if Path(abalone_fname).is_file():
    abalone = pd.read_feather(abalone_fname)
else:
    abalone = fetch_abalone()

datasets = fetch_datasets(filter_data=('ozone_level', 'coil_2000'))
thr = 16
datasets[f'abalone_{thr}+'] = abalone_Xy(thr=thr)

ds_info = pd.DataFrame(get_stats(ds) for ds in datasets.values())
ds_info

Coil 2000
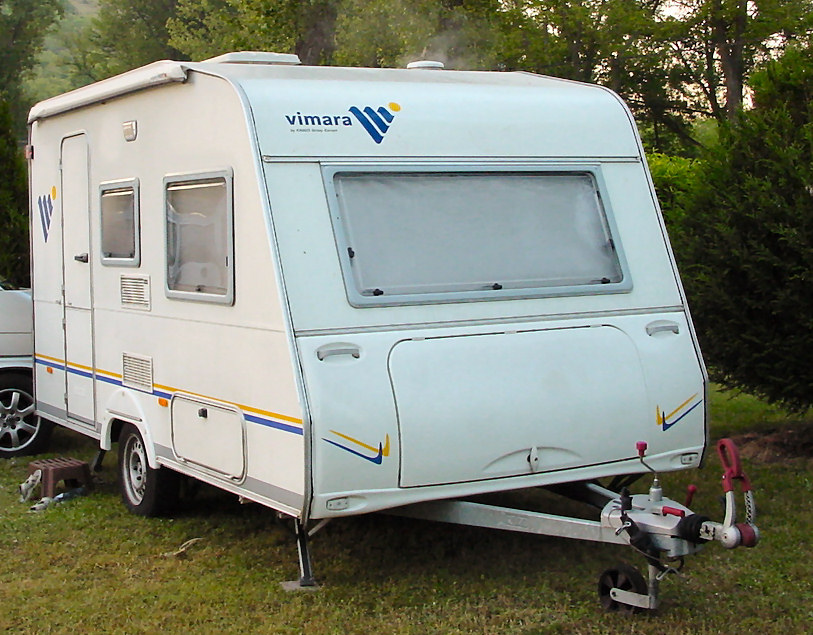
This dataset was used for the CoIL data mining competition. It is an insurance dataset where the goal is to predict which customers of a Dutch insurance company own an insurance policy covering a caravan. The features include socio-demographic data (derived from postal codes) and product ownership data. Importantly, all continuous features have been discretized in advance by the company.
Abalone
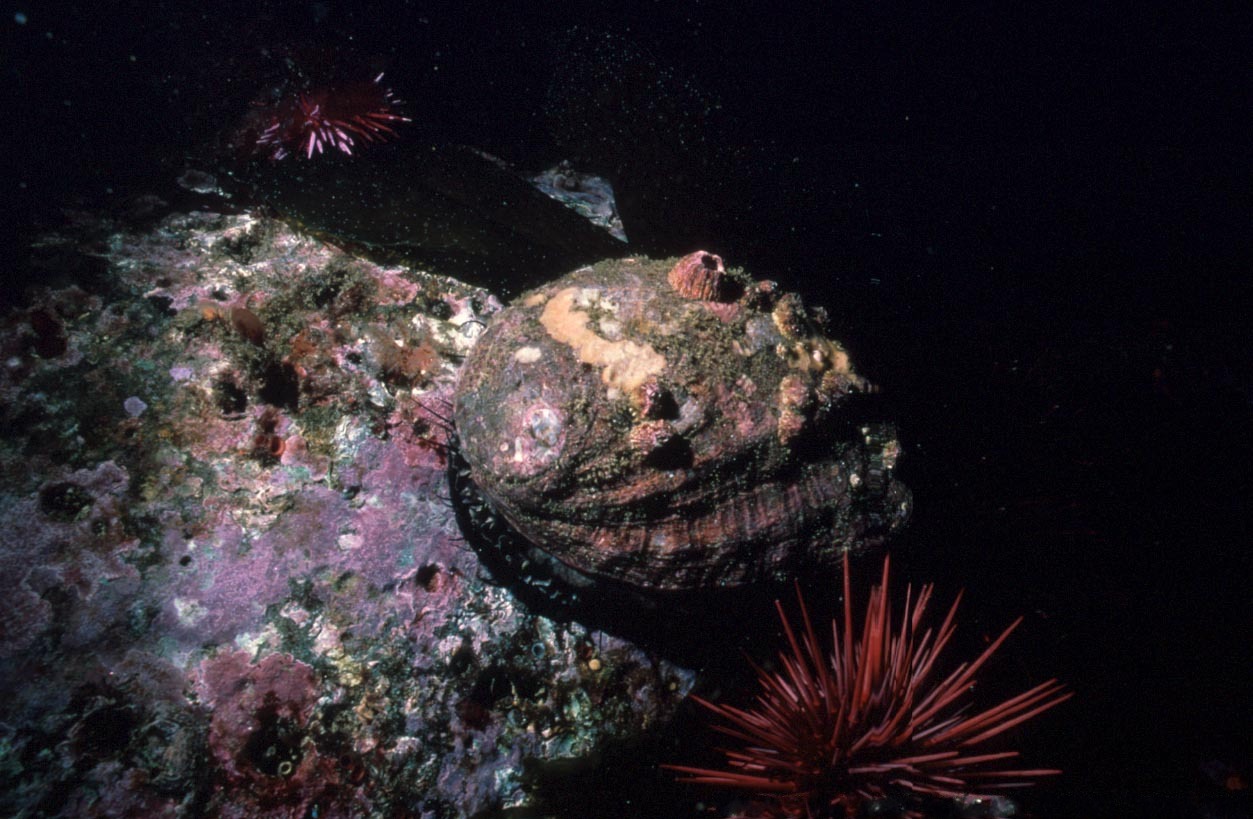
Abalone are molluscs and a type of marine snail. This dataset contains physical measurements of abalone (weight, size, length, sex) and the target variable is the number of rings (which is related to their age). The ground truth for the rings is obtained by cutting the shell and staining it, which is a time-consuming task, whereas the physical measurements are more easily obtained.
For the purposes of creating an imbalanced dataset, we take all abalone with rings >= 16 as the minority class at about 6%.
Models
Dealing with imbalanced datasets often involves resampling. For example, we can under-sample the majority class, over-sample the minority class, or do a combination of the two. There are also methods that over-sample based on specific rules, which might involve generating synthetic examples. e.g., see the family of SMOTE methods in the imbalanced-learn library.
Bagging methods can be a particularly good fit for imbalanced datasets because resampling is already part of the algorithm. All we need to do is to modify the resampling procedure to introduce rebalancing of the dataset. This is already implemented for us in imblearn.ensemble. For example, a BalancedRandomForestClassifier(sampling_strategy=0.5) is similar to a regular Random Forest, but each tree will be fitted to a rebalanced dataset, where the ratio of minority- to majority-class samples is 0.5
The models we use are:
- Baseline model: RandomOversampler followed by a single logistic regression, trained on the rebalanced dataset.
- Balanced Random Forest (or a Bag of Trees)
- Balanced Bag of Logistic Regressions. Similar to the balanced forest, but the base model is a logistic regression.
The rationale for this choice is that a balanced forest model might be able to capture non-linear relationships and interactions between variables, but the bag of logistic regressions might be more robust to overfitting in the imbalanced setting where label information is sparse.
The code below includes the model definitions:
def get_clfs(sampling_strategy, max_features=0.5):
    """Define ensemble classifiers for experiment.

    sampling_strategy: float or str
        Target ratio for minority / majority class when rebalancing.
        With sampling_strategy=0.5, there will be twice as many samples in the majority class
        after the rebalancing procedure.
    max_features: the proportion of features to draw at each resampling.
    """
    return {
        'single_logistic': make_pipeline(
            StandardScaler(),
            RandomOverSampler(sampling_strategy=sampling_strategy),
            LogisticRegression(penalty='l2')
        ),
        'logistic_bag': make_pipeline(
            StandardScaler(),
            BalancedBaggingClassifier(
                base_estimator=LogisticRegression(penalty='l2'),
                sampling_strategy=sampling_strategy,
                max_features=max_features,
                n_estimators=20
            )
        ),
        'balanced_forest': BalancedRandomForestClassifier(
            min_samples_split=10,
            sampling_strategy=sampling_strategy,
            n_estimators=100,
            max_features=max_features)
    }
Evaluation
To evaluate the models, we will use 10-fold cross-validation, using a stratified split, that will ensure that each split receives roughly the same number of positive examples. This should produce more stable results for imbalanced dataset compared to a regular cross-validation based on a shuffled split.
We will examine the precision-recall curves obtained from the cross-validation. We also pick somewhat arbitrarily a recall threshold of 60%, and see which model will obtain better precision at that level.
#collapse
def run_exp(ds, clf, seed=42):
    """Given a dataset ds and classifier clf, run a cross-validation experiment."""
    X, y = ds['data'], ds['target']
    cv = StratifiedKFold(n_splits=10, shuffle=True, random_state=seed)
    scores = cross_validate(clf, X, y, cv=cv, n_jobs=-1,
                            scoring=['balanced_accuracy', 'f1', 'precision', 'recall'])
    y_probs = cross_val_predict(clf, X, y, method='predict_proba', cv=cv, n_jobs=-1)[:, 1]
    scores['y_probs'] = y_probs
    return scores

def plot_precision_recall(y_true, y_probs, ax=None, **plot_kwargs):
    ax = ax or plt.gca()
    prec, recall, thr = precision_recall_curve(y_true, y_probs)
    ax.plot(recall, prec, **plot_kwargs)
    ax.set_ylabel('Precision', fontsize=12)
    ax.set_xlabel('Recall', fontsize=12)
    ax.set_ylim(0, 1)
    return ax

def collect_results(datasets, clfs):
    """Collect experiment results.

    The results shape is {<dataset_name>: {'classifier_name'}: result}
    """
    results = defaultdict(dict)
    for (ds_name, ds), (clf_name, clf) in tqdm(product(datasets.items(), clfs.items()),
                                               total=len(datasets) * len(clfs)):
        results[ds_name][clf_name] = run_exp(ds, clf)
    return results
results = collect_results(datasets, get_clfs(sampling_strategy=0.5))
with open('base_results.pickle', 'wb') as f:
    pickle.dump(results, f)
#collapse
fig, axes = plt.subplots(nrows=1, ncols=3, figsize=(14, 3.5), sharey=True)
for i, (ds_name, ds_dict) in enumerate(results.items()):
    ax = axes[i]
    y_true = datasets[ds_name]['target']
    for clf_name, res in ds_dict.items():
        ax = plot_precision_recall(y_true, res['y_probs'], ax=ax, label=clf_name)
    ax.set_title(ds_name)
    ax.legend()
    ax.grid(True)

For the Ozone dataset, the bag of logistic regressions outperforms the balanced forest, at least for near the recall region of interest at recall=0.6. On the other hand, the balanced forest does slightly better on the Abalone dataset.
Both models do poorly on the Coil dataset. Sadly, one of the great challenges of our time, predicting caravan insurance policy, remains unsolved.
Note that the Ozone dataset includes 72 features, but it is the most imbalanced, at about 2.9%. The amount of signal available from the limited positive labels is likely quite sparse. This is possibly why the bag of logistic models does better than the balanced forest.
The Abalone dataset contains the smallest number of features (10). It is possible that the ability of the random forest to capture interactions and non-linear effects gave it a slight edge over the other model.
Isn't a bag of linear models simply a linear model?
It depends on the linear model, and how the individual models' predictions are combined in the bag. Indeed, for regression problems, a bag of linear regressions will produce another linear model. Logistic regression, however, includes a link function:
$$p_i(x) = \frac {1}{1+e^{-\mathbf{w x_i}}}$$
where $\mathbf{w}$ is the vector of weights fitted in the model, and $p_i$ is the predicted probability for example $x_i$.
In a BaggingClassifier, we are averaging the predicted probabilities of the base models - basically it uses the predict_proba method averages these together. For example, with two models, we obtain:
$$p_{i, bag}(x) = \frac{p_{i, 1} + p_{i, 2}}{2} = \frac{1}{2} [\frac {1}{1+e^{-\mathbf{w_1 x_i}}} + \frac {1}{1+e^{-\mathbf{w_2 x_i}}}]$$
This combination of the $p_i$ value will not necessarily produce a linear decision boundary as long as the weights $\mathbf{w_i}$ are sufficiently different. We can generate a few toy 2D datasets to illustrate this.
#collapse
def make_imbalanced_blobs(n_positive, n_negative=400, randon_state=0):
    """Creates a synthetic dataset with four blobs, where the blob at
    (0, 0) is the negative class.

    By setting n_positive to a small number, we can create an imbalanced dataset.
    """
    centers = [(0, 0), (5, 5), (5, -5), (-5, 5)]
    total = n_negative * len(centers)
    assert n_positive + n_negative <= total, f'n_positive + n_negative exceeds total {total}'
    X, y_blob = make_blobs(n_samples=n_negative * len(centers), centers=centers,
                           shuffle=False, random_state=randon_state)
    X_center = X[y_blob == 0]  # negative class
    X_side   = X[y_blob != 0]  # positive class before resampling
    sample = np.random.choice(len(X_side), size=n_positive, replace=False)
    X_side = X_side[sample]

    X = np.concatenate([X_center, X_side])
    y = np.concatenate([np.zeros(len(X_center), dtype=int),
                        np.ones(len(X_side),    dtype=int)])
    return X, y

def plot_blobs_with_boundaries(clfs, X, y):
    """Plots the decision boundaries for classifiers clfs, given
    a blobs dataset. One plot for each classifier is created.
    """
    for clf in clfs.values(): clf.fit(X, y)

    x_min, x_max = X[:, 0].min() - 1, X[:, 0].max() + 1
    y_min, y_max = X[:, 1].min() - 1, X[:, 1].max() + 1
    xx, yy = np.meshgrid(np.arange(x_min, x_max, 0.1),
                         np.arange(y_min, y_max, 0.1))

    fig, axes = plt.subplots(nrows=1, ncols=len(clfs), figsize=(14, 4))

    for ax, (clf_name, clf) in zip(axes, clfs.items()):
        Z = clf.predict_proba(np.c_[xx.ravel(), yy.ravel()])[:, 1]
        Z = Z.reshape(xx.shape)
        ax.contourf(xx, yy, Z, alpha=0.4)
        ax.scatter(X[:, 0], X[:, 1], c=y, s=20, edgecolor='black')
        ax.set_title(clf_name)
Below we plot a toy dataset which is not linearly separable. In the first example below we use a large number for the n_positive parameter in the make_imbalanced_blobs function (expand cell above). This effectively creates a fairly balanced dataset. We plot the decision boundaries for the two ensemble classifiers we used above.
X, y = make_imbalanced_blobs(n_positive=200)
plot_blobs_with_boundaries(get_clfs(sampling_strategy='auto'), X, y)

The bag of logistic regressions generates a near-linear decision boundary, so it is unable to effectively separate the classes. As expected, the balanced forest easily separates this dataset.
Now let's examine the imbalanced version of the dataset. The new decision boundaries are plotted below.
X, y = make_imbalanced_blobs(n_positive=20)
plot_blobs_with_boundaries(get_clfs(sampling_strategy=0.5), X, y)

We see that the decision boudary for the bag of logistic models has changed substantially, and is now non-linear. It is also better able to fit the dataset. In comparison, the balanced forest decision boundary is mostly the same.
Can we use bagging with a low-variance estimator like logistic regression?
As we see above, when we apply the bag of logistic regressions to a balanced dataset, most of the logistic models will tend to agree on the fitted coefficients, resulting in a near-linear boundary. There is little benefit of combining many nearly-identical models.
On the other hand, when using imbalanced datasets, the individual models exhibit high variance in the fitted weights, so combining them in a bag might produce a robust classifier.
Conclusion
Ensemble models provide a natural ways of dealing with imbalanced datasets, by incorporating a re-balancing procedure in the resampling. Logistic regression is not commonly used as a base model in bagging since it is a low-variance estimator. In imbalanced settings, even logistic regression can exhibit high variance. This is especially the case as we increase the dimensionality of the problem. In those cases, a bag of logistic regressions might produce competitive results.